Understanding what one candlestick records
The body and shadows summarize four price observations within one selected interval.
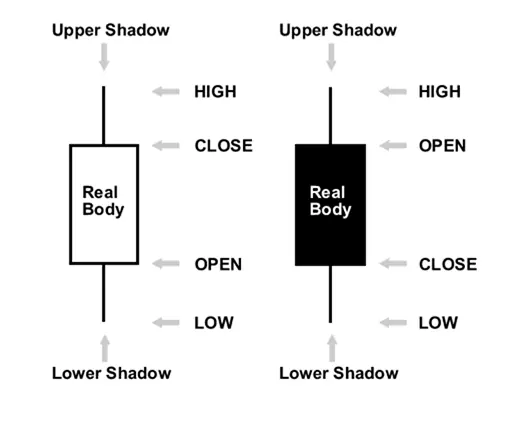
BabyPips describes a candlestick as a compact representation of the open, high, low and close for a chosen period. The body connects the opening and closing prices, while the shadows show the extremes reached during that interval.
Color usually indicates whether the close is above or below the open, but platform conventions should be checked. The size and position of a candle are descriptions of what happened within a period. They do not reveal every transaction or the exact sequence of movements inside the interval.
Shorter periods can be combined into longer ones: the first open, last close and overall extremes define the larger candle. This helps explain why a pattern can look different across chart settings. Learning the anatomy is useful before studying named formations, but a single candle is not evidence that a future reversal is assured.
Image source: BabyPips
Research sources & methodology
Original sources and publication references.
Community