Treating support and resistance as chart observations
Historical turning areas can organize a chart, but they do not impose a floor or ceiling on future prices.
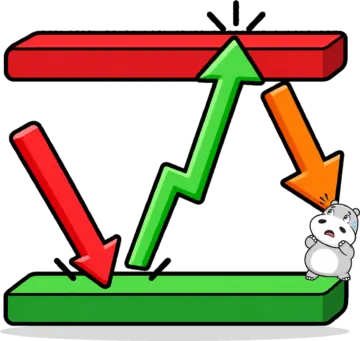
The lesson describes support as an area where buying interest has previously interrupted a decline and resistance as an area where selling interest has interrupted a rise. These observations help chart readers organize earlier price behavior.
BabyPips also cautions that such areas are not exact numbers. A temporary move through a marked level may be interpreted differently from a sustained break, and a former resistance area may later be discussed as support. The classification depends on the chart and the criteria being used.
For a reproducible analysis, record the time frame, data source and reasons for drawing a zone before evaluating later prices. A line added after an outcome is known can make the chart look more predictive than it was. Historical reactions provide context, but no marked area guarantees that future buying or selling will occur.
Image source: BabyPips
Research sources & methodology
Original sources and publication references.
コミュニティ